Eurostat reported a fall in electricity prices for non-household consumers in the EU on 4 November 2026. The average in the first half of 2026 was €0.18 per kilowatt-hour, 5.4% below a year earlier. Its new release describes a completed measurement period, rather than a current daily price or a new tariff decision.
Eurostat reports €0.18 per kilowatt-hour for a defined consumption band
Key facts
- The EU average fell by 2.0% compared with the second half of 2025.
- The decrease from the first half of 2025 was 5.4%.
- The consumption band covered uses between 500 and 2,000 megawatt-hours a year.
- Prices fell annually in 19 EU countries and increased in eight.
The different comparison periods matter. The half-year decline and the annual change concern the same new price observation, but different starting points. They should neither be added together nor treated as two successive discounts for an individual company. The figures also do not establish that every business pays the same price.
According to the methodological explanation, these are average retail prices within a defined consumption band. For non-household customers, VAT and other recoverable taxes or levies are excluded. Production, supply, network costs and non-recoverable charges are included in the price measure shown. A pure wholesale exchange price would therefore measure something different.
The consumption classification is central to interpretation. A business with significantly higher or lower annual use does not automatically fall within the band presented. Eurostat distinguishes several non-household consumption bands. Supply contracts and fixed charges can also vary. The rounded EU figure is consequently a benchmark for that band, rather than a promise about a particular bill.
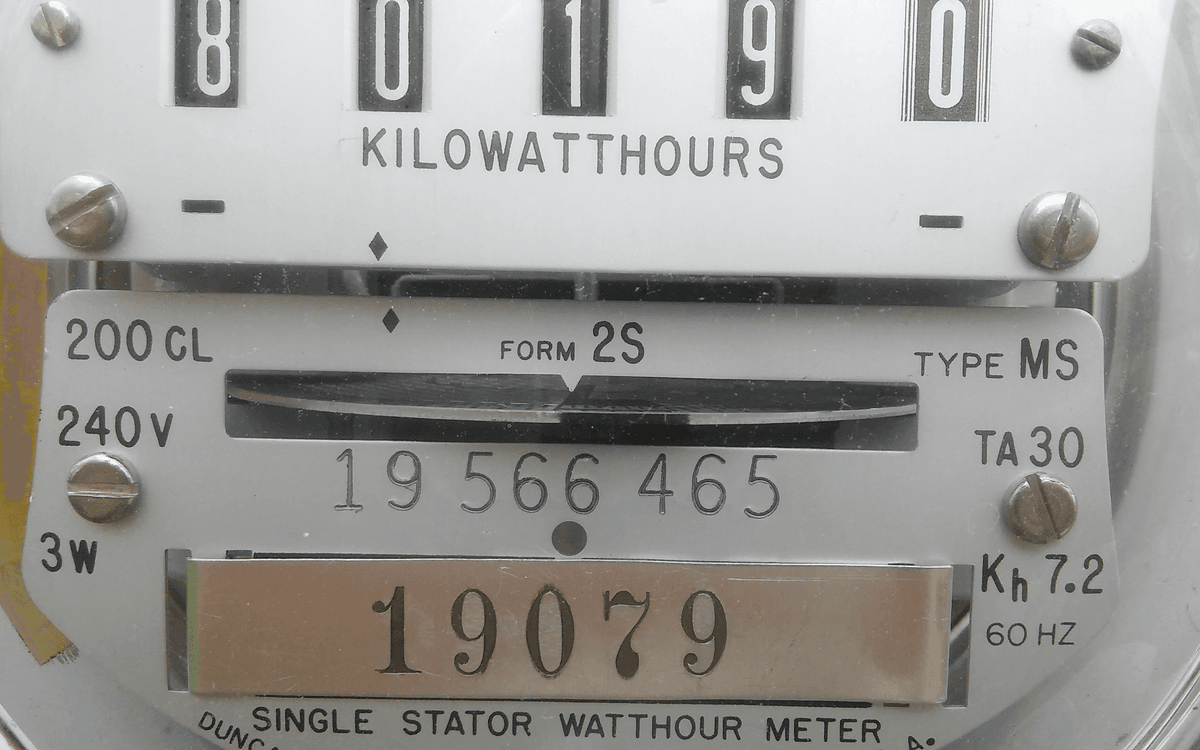
For clarity on the unit, one megawatt-hour equals 1,000 kilowatt-hours. The band therefore runs from 500,000 to 2 million kilowatt-hours of annual use. This conversion does not change the price per kilowatt-hour; it simply makes clear the scale of electricity consumption covered by the comparison.
National differences and the limits of energy-policy conclusions
Eurostat reported the highest prices in Ireland, at €0.27 per kilowatt-hour, followed by Cyprus and Italy at €0.23 each. Finland had the lowest figure, at €0.09, followed by Sweden at €0.12. Denmark, Spain and Portugal each recorded €0.13. Country comparison
Luxembourg had the largest annual fall, at 23.8%, followed by Czechia at 11.9% and Greece at 11.8%. The largest increases were in Sweden, at 18.8%, Finland at 18.7% and Bulgaria at 14.2%. The accompanying chart identifies the annual changes as comparisons in national currencies. A low price level and a large percentage increase are not contradictory, because they answer different questions.
The data do not identify a single cause for the changes. The methodological overview lists influences including the energy mix, supply, network costs and taxation. The new average cannot therefore establish the contribution of an individual policy measure to the overall development.
That distinction also applies to Germany's debate on offshore auctions and investment protection. That debate concerns future revenue protection and delivery of awarded wind projects. The newly published retail prices establish neither the effectiveness of the proposed auction model nor the enactment of a reform.
The next developments to follow are further statistical releases and any data revisions. The announcement specifies no new future electricity tariff or binding price forecast. Our Europe section therefore distinguishes measured price developments, legislative proposals and changes that actually apply.